


I'm a software developer specializing in interactive data visualizations, complex user interfaces, and, since 2023, combining those with generative AI.

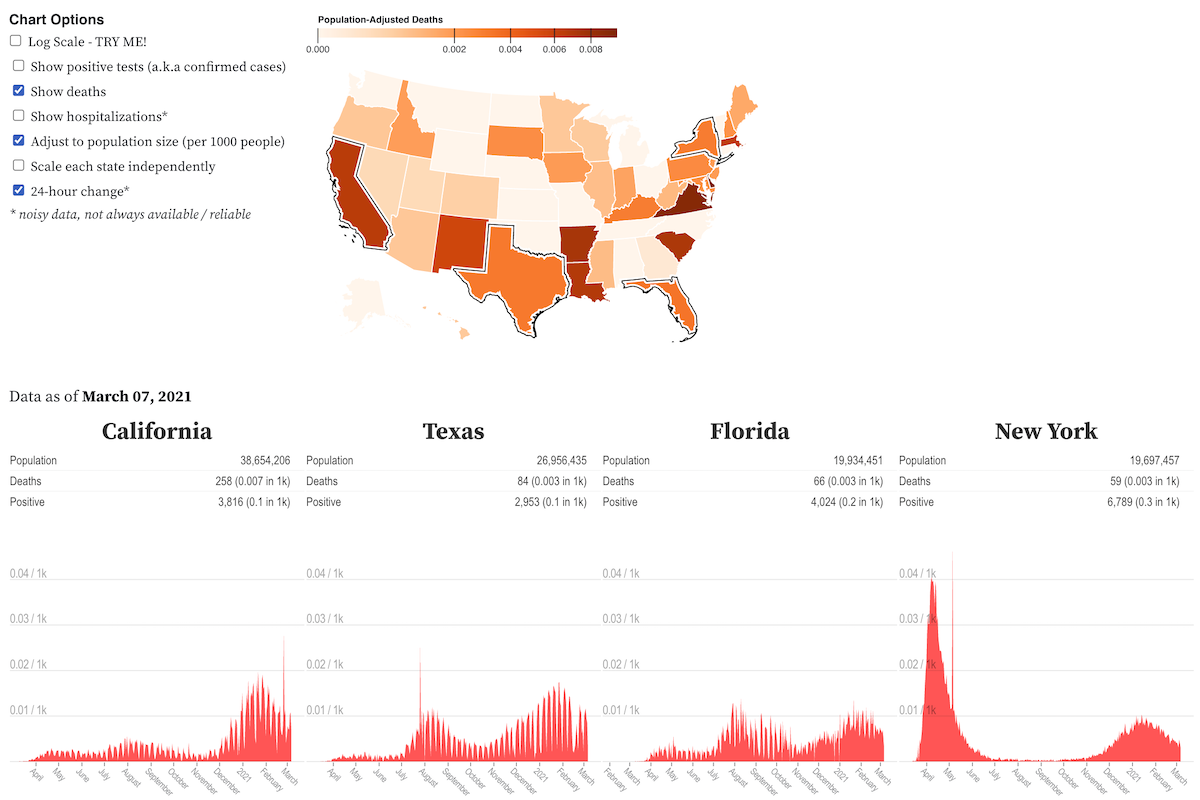
Most recently, I worked on portfolio analysis tools at asset management firm Lazard, followed by a stint freelancing and building personal projects leveraging AI. Previously, I co-founded the award-winning agency TWO-N and led design and development of countless data visualization projects completed by our 10-person team. I've worked in many domains and with a wide variety of datasets, including financial equities, P&I, geospatial, demographics, network data, advertising, architectural, and broadcast.
You are invited to explore any of the work on the projects page. If you're specifically looking for my professional work, you could start with any of these projects:
Or, have a look at these projects that prominently feature AI:
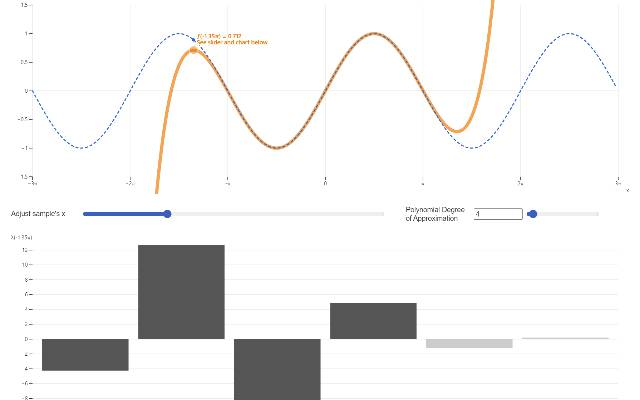
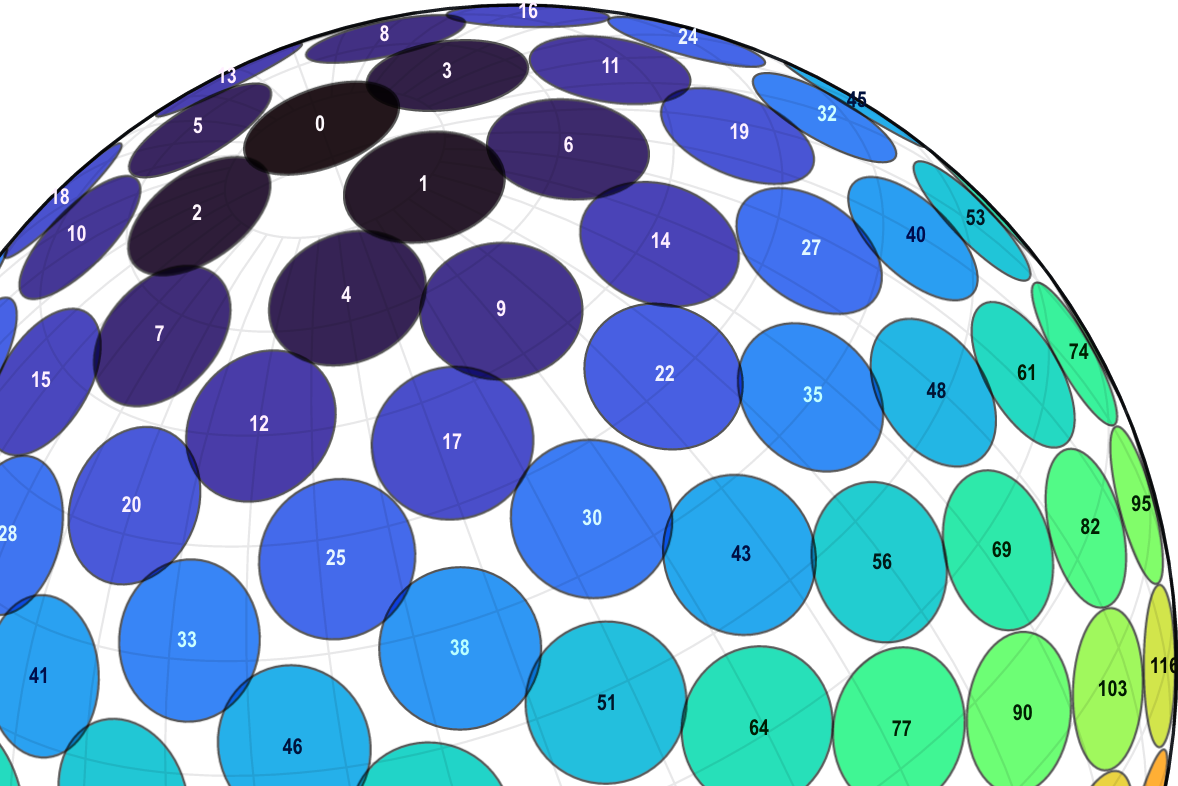
If you're interested in generative art, plotters, mathematical concepts, or impractical ideas, check out these projects: